
Thank you for reading our post, please rate this article at the end.
Reading Time: 19 minutesLast Updated on April 29, 2026 by Paul Clayton
Table of Contents
New vs. Used RV: Navigating the Price Trends
Key Takeaways
-
- New RV sales are declining while used RV markets remain stable, creating better negotiating opportunities for buyers
- RV prices are normalizing to pre-pandemic levels rather than experiencing dramatic crashes
- Seasonal timing and economic factors like interest rates significantly impact both new and used RV pricing strategies
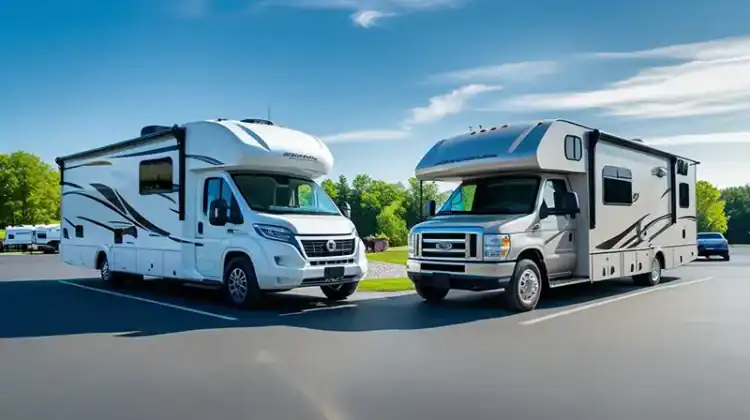
The RV market has undergone dramatic changes since the pandemic boom, leaving many buyers confused about whether to purchase new or used. While a few years ago saw used RVs selling for more than new model prices, the market has now entered a stabilization phase with more balanced inventory levels and predictable pricing patterns.
Today’s RV buyers face a fundamentally different landscape where new RV sales are declining while the used market remains steady, creating unique opportunities for savvy purchasers who understand current trends. New RV sales are down, but the used RV market is holding steady according to recent data, marking a clear shift from the frenzied buying conditions of recent years.
The decision between new and used RVs now depends heavily on timing, financing options, and individual priorities rather than simple availability. With RV prices stabilizing rather than crashing and inventory improvements giving buyers more leverage, understanding these market dynamics becomes essential for making the right purchase decision.
New vs. Used RV: Key Differences in Today’s Market
The RV market has experienced significant shifts in pricing structures, inventory levels, and buyer experiences between new and used options. Price gaps have widened substantially while availability patterns have shifted dramatically across both segments.
Major Price and Value Contrasts
New RV prices have increased significantly over recent years, creating a larger gap between new and used options. The average new RV now costs 40-60% more than comparable used models from 2-3 years ago.
New RV Pricing Structure:
- Entry-level travel trailers: $25,000-$40,000
- Mid-range motorhomes: $80,000-$150,000
- Luxury coaches: $200,000-$500,000+
Used RV prices have stabilized after the pandemic surge but remain elevated compared to levels just a few years ago. Models 3-5 years old typically retain 60-70% of their original value, which represents slower depreciation than historical norms.
Can You Rent an RV for a Year?
Depreciation Patterns:
- First year: 15-20% value loss
- Years 2-3: 10-15% annually
- Years 4-5: 8-12% annually
Professional inspection services are increasingly important for used RV purchases due to price volatility. Buyers can expect to pay $300-$500 for comprehensive inspections on units over $50,000.
Inventory and Availability Shifts
New RV inventory has recovered from pandemic shortages, but delivery times remain extended. Most manufacturers quote 8-16 weeks for custom orders, with popular models experiencing longer waits during peak season.
Current Inventory Trends:
- High availability: Entry-level travel trailers, basic motorhomes
- Limited availability: Luxury coaches, specialty off-road models
- Seasonal fluctuations: Peak inventory in fall, lowest in spring
Used RV availability varies significantly by region and price point. Market research platforms like RV Trader and RVUSA show approximately 30% more used inventory than at previous levels.
Popular used models under $75,000 move quickly, often selling within 30-45 days of listing. Higher-end used units may sit for 60-90 days, providing more negotiation opportunities for buyers.
Ownership Experience Changes
New RV buyers receive comprehensive manufacturer warranties typically lasting 1-3 years, depending on components. These warranties now include roadside assistance and often cover appliances, structural elements, and drivetrain components separately.
Warranty Coverage Breakdown:
- Structural: 2-3 years
- Appliances: 1-2 years
- Drivetrain: 3-5 years (motorhomes)
Used RV ownership involves immediate responsibility for all repairs and maintenance. However, many issues have already been identified and resolved by previous owners, potentially reducing unexpected problems.
Technology and features in new RVs include smart home integration, improved insulation, and energy-efficient systems. Used RVs may lack these advances but often come with aftermarket upgrades installed by previous owners.
Financing terms differ substantially between new and used purchases. New RVs qualify for longer loan terms (10-20 years) with lower interest rates, while used RV loans typically max out at 10-15 years with higher rates.
How Shifting Market Trends Are Impacting RV Buying Decisions

Market volatility and economic uncertainty are causing buyers to reconsider their RV purchasing timeline and budget allocation. Current financing conditions and consumer confidence levels are reshaping how people approach both new and used RV investments.
Consumer Confidence and Buyer Hesitation
Consumer confidence in the RV market reflects broader economic concerns that influence purchasing decisions. Many potential buyers are delaying purchases as they assess whether RV prices will continue declining.
Current buyer behaviors include:
- Waiting for better deals on inventory
- Comparing new versus used options more carefully
- Seeking lower-priced alternatives
The RV Industry Association reports that buyer hesitation stems from uncertainty about future price movements. Consumers worry about making large purchases during market transitions.
This cautious approach means dealers face longer sales cycles. Buyers spend more time researching and comparing options before committing to purchases.
Effects of Economic Uncertainty
Economic uncertainty directly impacts RV buying patterns as consumers prioritize financial stability. Market trends now show buyers favoring practical choices over premium features.
Rising inflation affects discretionary spending on recreational vehicles. Many consumers shift toward used RVs to reduce initial investment costs.
Economic factors influencing decisions:
- Job market stability concerns
- Reduced disposable income
- Inflation’s impact on household budgets
RV traders report increased demand for budget-friendly options. Buyers tend to prefer units under $50,000 over high-end models exceeding $100,000.
The uncertain economic climate pushes consumers toward proven value propositions. Used RVs offer established reliability records at lower price points.
Role of Financing and Interest Rates
Interest rate fluctuations significantly affect RV affordability and buyer qualification standards. Higher rates increase monthly payments, making financing less attractive for many consumers.
Financing challenges include:
- Stricter lending requirements
- Higher down payment expectations
- Reduced loan terms for used RVs
Banks now require stronger credit scores for RV loans. This change eliminates some buyers from the market entirely.
The RV industry faces reduced sales volume due to financing constraints. Dealers offer more incentives and manufacturer financing programs to maintain sales momentum.
Used RV financing typically carries higher interest rates than new RV loans. This factor sometimes makes new RVs more attractive despite higher sticker prices.
Buyers increasingly consider cash purchases to avoid financing costs. This trend favors the used market, where lower prices make cash transactions more feasible.
RV Price Trends: Insights and Forecasts
The RV market has experienced significant shifts from pandemic highs to current stabilization. RV prices are normalizing rather than crashing, with distinct patterns emerging across new and used segments.
New RV Price Surges and Corrections
New RV manufacturers faced unprecedented demand during 2020-2022, leading to inflated prices and extended waiting lists. Many models sold at or above MSRP with minimal negotiation room.
New RV prices are likely to remain stable or decrease slightly for most categories 2025 and 2026. Manufacturers are focusing on competitive pricing to attract cautious buyers facing high interest rates.
A notable trend has emerged called “decontenting.” Manufacturers are removing non-essential luxury features to create more affordable entry points. This strategy targets price-conscious consumers while maintaining profit margins.
Key New RV Pricing Factors:
- Lower-end models: Gaining popularity with stripped features
- High-end RVs: Holding steady pricing
- Mid-range models: Struggling with decreased demand
RV shipments are projected to climb to the mid-300,000 range by year-end before increasing further in the future.
Used RV Price Normalization
Used RV prices reached absurd levels during the pandemic boom. Some used models sold for more than their new MSRP prices, creating an unsustainable market bubble.
The correction has been gradual rather than dramatic. Used RV prices are stabilizing, not crashing, with different segments showing varying patterns.
Wholesale RV auction values have shown mixed results lately. Towables declined while motorhomes increased, though remaining below previous month levels.
Current Used RV Market Conditions:
- Travel trailers: Showing modest price corrections
- Class A motorhomes: More stable pricing retention
- Class B vans: Still commanding premium prices
- Pop-up campers: Significant value drops
Inventory levels have improved dramatically, giving buyers more negotiating power and selection options.
Factors Causing Price Fluctuations
Interest rates remain the primary driver affecting RV affordability. Even with stable RV prices, higher financing costs significantly impact monthly payments and buyer qualification.
Economic Influences:
- Interest rates: 6-8% typical for RV loans
- Consumer confidence: Affecting discretionary spending
- Inflation: Impacting manufacturing costs
- Fuel prices: Influencing motorhome demand
Supply chain recovery has increased inventory availability. Manufacturers can now meet demand more effectively, reducing artificial scarcity that drove pandemic pricing.
Seasonal patterns have returned to normal cycles. Late fall and winter months offer better pricing opportunities, while spring and summer command premium prices.
Market Dynamics:
- Dealer inventory: 40-60% higher than pandemic lows
- Production capacity: Near pre-pandemic levels
- Regional variations: Sunbelt states showing stronger demand
- Trade-in values: Stabilizing after volatile years
The RV market moved closer to stability last year, with new and used sales trends revealing key shifts by category and region.
RV Sales and Shipments: Comparing New and Used Performance
 The RV market shows distinct patterns between new and used segments, with national data revealing declining shipments while dealer strategies adapt to changing inventory demands. Market performance varies significantly across different sales channels and geographic regions.
National vs. Dealer Sales Data
New RV sales have experienced significant declines in recent years. The RV Industry Association reports that shipments dropped substantially from peak pandemic levels.
Dealer networks report mixed results across different regions. Some dealers maintain stronger used RV inventory turnover while new unit sales lag behind historical averages.
Key Performance Indicators:
- New RV shipments decreased by double digits
- Used RV sales show more stability in transaction volume
- Regional variations create uneven market conditions
Price compression affects both segments differently. New RVs face manufacturer pricing pressures while used units benefit from lower depreciation rates than in previous years.
Market experts note that dealer strategies vary significantly between new and used inventory management approaches.
Trends in RV Shipments
Manufacturing shipments reflect broader economic pressures on the RV industry. Production facilities reduced output to align with decreased demand from dealer networks.
Monthly Shipment Patterns:
- Q1: Sharp decline in new unit deliveries
- Q2-Q3: Stabilization at lower volumes
- Q4: Seasonal uptick remained below historical norms
Used RV availability increased as trade-ins accumulated at dealerships. This inventory buildup created opportunities for buyers seeking pre-owned units with better value propositions.
Industry analysts suggest that RV sales trends indicate market corrections continue into the latter part of the year. Shipment data shows manufacturers adjusting production schedules to match realistic demand forecasts.
Supply chain improvements have stabilized delivery times for new units. However, reduced shipment volumes mean fewer new models entering the market compared to peak years.
Inventory Management and Dealer Strategies
Dealerships adopted different approaches for managing new versus used inventory levels. Many locations increased used RV lot space while reducing new unit orders from manufacturers.
Can You Rent an RV for a Year?
Dealer Inventory Strategies:
- Expanded use of RV reconditioning programs
- Reduced new unit floor planning commitments
- Increased trade-in acceptance rates
- Enhanced financing options for pre-owned units
Floor planning costs influenced dealer decisions about inventory mix. Used RVs typically require less capital investment and offer faster turnover rates during slower market periods.
Certified pre-owned programs gained popularity as dealers sought to differentiate used inventory. These programs bridge the gap between new unit warranties and traditional used RV sales.
Geographic markets show varying dealer performance levels. Sunbelt regions maintain stronger sales volumes while northern markets face seasonal inventory challenges.
Dealers report that financing availability impacts both new and used RV sales differently, with used units often requiring different lending approaches than new unit financing programs.
Understanding RV Inventory: Dealer Lots, Backlogs, and Model Turnover
RV inventory management involves complex cycles of manufacturer production, seasonal demand fluctuations, and strategic dealer stocking decisions. The wide range of RV models complicates inventory control as dealers balance diverse customer preferences with cash flow considerations.
Dealer Stocking Patterns
Dealers typically maintain higher inventory levels during spring and early summer when RV sales peak. Most dealerships stock 60-80% of their annual inventory between March and July to capture prime selling season demand.
Seasonal Allocation Strategy:
- Spring (March-May): 35-40% of annual inventory
- Summer (June-August): 25-30% of annual inventory
- Fall (September-November): 20-25% of annual inventory
- Winter (December-February): 15-20% of annual inventory
Floor planning financing allows dealers to stock units without immediate payment to manufacturers. This system enables broader model selection but creates pressure to turn inventory quickly to minimize interest costs.
Geographic location significantly influences stocking patterns. Northern dealers often reduce inventory dramatically in the winter months, while southern and western dealers maintain more consistent year-round stock levels.
Popular travel trailer and Class C motorhome models typically turn over every 45-90 days during peak season. Luxury Class A units may remain on lots for 6-12 months before sale.

Model Year Cycles
RV manufacturers typically release new model years between August and October, coinciding with major trade shows like the RV Industry Association’s National Trade Show. This timing allows dealers to showcase updated features for the following year’s selling season.
Model Year Timeline:
- August-September: New models debut at trade shows
- October-December: Initial dealer orders and deliveries
- January-March: Full production ramp-up
- April-July: Peak production and delivery period
Current data shows RV shipments rose nearly 16% as new models roll onto dealer lots. Year-to-date shipments reached 190,705 units, representing a 6.8% increase compared to the previous year.
Previous model year inventory typically receives significant discounts starting in late summer. Dealers offer 10-25% markdowns on outgoing models to clear space for incoming units.
The transition period between model years creates opportunities for buyers seeking deals on previous year models. However, warranty coverage and resale values may be slightly affected by purchasing older model-year units.
Impact on Buyer Opportunities
New RV Market Conditions: Current market data indicates new RV sales are down while the used RV market holds steady. This shift creates distinct opportunities depending on buyer preferences and timing flexibility.
Buyers benefit from increased negotiation leverage when new inventory levels are high. Dealers facing carrying costs on aging inventory often accept lower profit margins to move units.
Optimal Buying Windows:
- Late summer/early fall: Best discounts on current model year
- Winter months: Lowest prices but limited selection
- Early spring: Balanced pricing and inventory levels
The recent shift shows dealers managing tighter margins while maintaining inventory. Inventory turnover remains a critical metric for dealership performance optimization.
Buyers should monitor local dealer inventory levels through online tools and direct communication. Many dealers provide real-time inventory updates showing available units, pricing, and arrival dates for ordered models.
Timing purchases around model year transitions and seasonal inventory cycles can result in savings of $5,000-$15,000 on new RV purchases.
Key Platforms and Industry Influencers in the RV Marketplace
Major online platforms dominate RV buying and selling, while established manufacturers and dealers shape pricing through their market practices. Digital marketplaces like RV Trader control inventory visibility, and rental platforms influence used RV values through fleet turnover.
Role of RV Trader and RVShare
RV Trader serves as the primary marketplace for both new and used RV sales nationwide. The platform lists inventory from thousands of dealers and private sellers, making it the go-to resource for price comparisons.
Buyers can filter searches by price range, location, and specific features. The platform’s pricing data influences market trends since most dealers use it to gauge competitive pricing.
RVShare operates as the leading peer-to-peer RV rental platform. Owners list their RVs for short-term rentals, generating income that affects their decision to sell or keep units.
Outdoorsy competes directly with RVShare in the rental space. Both platforms create a secondary market where RV owners can offset ownership costs through rentals.
These rental platforms impact used RV prices by keeping more units in circulation longer. Owners who earn rental income delay selling their RVs, reducing used inventory and maintaining higher prices.
Dealer Practices and Guarantees
Modern RV dealerships have adapted their sales approaches to compete in the evolving marketplace. Consumer purchasing paths have changed rapidly due to the adoption of online tools and artificial intelligence.
Most dealers now offer comprehensive inspection reports for used RVs. They provide detailed photographs and virtual tours to attract remote buyers.
Warranty programs vary significantly between dealers. Some offer extended coverage on used units, while others sell units “as-is” with limited guarantees.
Trade-in programs have become more competitive as dealers seek inventory. Many dealers now accept trades on units they wouldn’t have considered previously.
Financing options have expanded with in-house lending becoming more common. Some dealers approve buyers with lower credit scores than traditional lenders require.

Notable Manufacturers and Brands
Jayco remains one of the most recognized names in the RV industry, producing both entry-level and luxury units. Their strong brand recognition helps maintain resale values across their product line.
Forest River, Thor Industries, and Winnebago represent the largest manufacturers by volume. These companies’ production decisions directly impact new RV availability and pricing.
Established dealers like Bish’s RV influence regional markets through their inventory practices and pricing strategies. Large dealerships often set pricing benchmarks for their territories.
Luxury manufacturers such as Airstream and Newmar maintain premium positioning. Their limited production keeps used values higher compared to mass-market brands.
Regional manufacturers focus on specific market segments. These smaller companies often produce specialized units that command premium prices in both new and used markets.
Consumer Strategies: Buying, Selling, and Trading in the Current Market
Smart RV buyers and sellers can maximize value by timing their transactions strategically, leveraging trade-in opportunities effectively, and adapting negotiation tactics to current market volatility.
Timing Purchases and Sales for Maximum Value
Seasonal patterns significantly impact RV pricing and inventory availability. Late fall and winter months typically offer the best buying opportunities as dealers clear inventory for new model years.
September through February represents peak buying season for savvy consumers. Prices drop 10-15% during these months compared to spring peaks.
End-of-model-year sales provide substantial savings on new RVs. Dealers often discount previous year models by $5,000-$15,000 to make room for incoming inventory.
The used RV market follows similar seasonal trends. Private sellers become more motivated during the winter months, creating opportunities for negotiation.
Economic indicators also influence timing decisions. Rising interest rates typically cool demand and create downward pressure on prices. Consumer spending behavior data shows that buyers become more price-sensitive during uncertain economic periods.
Sellers should list their RVs in late winter or early spring to capitalize on increasing demand as the camping season approaches.
Trade-Ins and Upgrade Opportunities
Trade-in values fluctuate based on market conditions and dealer inventory needs. Dealers may offer premium trade values when specific RV types are in high demand.
Research current market values using multiple sources before accepting trade offers. Online valuation tools provide baseline estimates, but actual values vary by region and condition.
Timing trade-ins strategically can increase value. Dealers often pay more for trade-ins during slow sales periods when they need inventory.
Consider private sales versus trade-ins for higher-value RVs. Private sales typically yield 15-20% more than trade values but require more time and effort.
Upgrade timing depends on personal usage patterns and market conditions. Upgrading during market downturns provides access to more inventory at better prices.
Evaluate the total cost of ownership when considering upgrades. Newer RVs may offer better fuel efficiency and lower maintenance costs that offset higher purchase prices.
Negotiating in a Volatile Market
Market knowledge provides crucial leverage in negotiations. Understanding local inventory levels, pricing trends, and seasonal patterns strengthens negotiating positions.
Research comparable sales and current listings before entering negotiations. This data supports price justifications and counteroffers.
Flexibility becomes essential in volatile markets. Buyers who can consider multiple models or brands have more opportunities and better deals.
Be prepared to walk away from negotiations. This strategy works particularly well when inventory levels are high or demand is soft.
Financing arrangements can become negotiation tools. Cash buyers often secure better prices, while dealers may offer pricing concessions for financing through their preferred lenders.
Consider total deal value rather than focusing solely on purchase price. Extended warranties, maintenance packages, and accessories add value that may justify higher base prices.
Documentation of RV condition, maintenance history, and upgrades supports pricing negotiations for both buyers and sellers. Detailed records justify premium pricing or highlight value propositions.

Economic Forces Reshaping the RV Industry
The RV industry faces significant pressure from inflation, shifting consumer spending habits, and restrictive lending conditions. These economic factors directly impact both new and used RV prices while influencing buyer behavior across all market segments.
Inflation’s Effect on RV Affordability
Rising material costs have pushed RV prices to historic highs across all categories. Steel, aluminum, and lumber prices increased substantially between 2020 and 2024, forcing manufacturers to pass these costs to consumers.
RV prices remain stubbornly high despite market corrections in other sectors. Entry-level travel trailers that cost $15,000 in 2019 now average $22,000 to $28,000 for comparable models.
Labor shortages compound the pricing pressure. Skilled RV technicians and assembly workers command higher wages, adding $3,000 to $8,000 to production costs per unit.
Used RV values reflect this inflationary pressure. Five-year-old motorhomes retain 65-70% of their original value compared to 45-55% pre-COVID.
Changing Patterns in Discretionary Spending
Consumer spending priorities shifted dramatically following economic uncertainty. Buyers now prefer smaller, more efficient RVs over luxury models.
Younger buyers reshape demand with smaller, smarter rigs while retirees downsize from Class A motorhomes to compact travel trailers. This demographic shift reduces average transaction values but increases unit sales volume.
Budget-conscious consumers increasingly choose used RVs over new purchases.
Essential features take priority over luxury amenities. Buyers focus on reliable mechanical systems, energy efficiency, and basic comfort rather than premium entertainment systems or high-end finishes.
Interest Rates and Loan Accessibility
The rate environment can add $150 to $400 monthly to typical RV payments.
Lenders tightened qualification standards significantly. Credit score requirements increased from 650 to 720 for favorable rates, while debt-to-income ratios must stay below 40%.
Loan terms shortened for many borrowers. Banks reduced maximum financing periods from 20 years to 15 years for motorhomes and from 15 years to 12 years for travel trailers.
Cash purchases increased as financing became less attractive. Dealers report 35% of transactions involve full cash payment compared to 18% in 2020.
Future Outlook: Predictions for New and Used RVs
The RV market faces significant transformation through 2026, with shipment increases projected to reach 329,900 to 362,300 units while pricing adjustments create distinct opportunities in both new and used segments. Market stabilization following post-pandemic corrections will reshape buyer strategies and manufacturer approaches.
Anticipated Market Corrections
The RV industry is moving toward a more balanced marketplace after years of pandemic-driven volatility. RV shipments have already increased nearly 16 percent as new models arrive at dealerships, bringing year-to-date totals to 190,705 shipments—up 6.8% from the previous year.
Industry experts predict that the RV market will stabilize as it returns to regular sales cycles. This correction will benefit buyers who faced limited inventory during peak demand periods.
The RV Industry Association data shows that dealer inventories have reached healthy levels. This inventory normalization creates competitive pressure that favors consumers in both pricing and selection.
Key correction indicators:
- Increased model availability across price ranges
- Reduced wait times for popular configurations
- More aggressive dealer incentives and financing options
Long-Term Supply and Demand Projections
RV manufacturers are adapting production strategies to meet evolving consumer demands. The industry projects steady growth with shipments expected to climb between 329,900 to 362,300 units this year, indicating sustained manufacturing confidence.
Consumer interest remains strong despite economic headwinds. The demographic driving demand includes both traditional retirees and younger buyers seeking flexible lifestyle options.
New RV sales show a decline while used RV markets hold steady, creating a two-tier market structure. This trend suggests buyers are increasingly price-conscious while maintaining purchase intent.
Demand factors shaping the near future:
- Remote work flexibility sustaining RV interest
- Multi-generational travel preferences
- Technology integration attracts younger demographics

What to Expect from RV Pricing
New RV pricing will likely see moderation as competition increases among manufacturers. The market reset indicates manufacturers are designing models for various budget ranges, suggesting more entry-level options will emerge.
Used RV prices face different pressures than new units. Market data indicates used values may remain elevated compared to historical norms, though they’re stabilizing from pandemic peaks.
Interest rate changes will significantly impact both segments. Lower financing costs could stimulate demand across all price categories, while continued high rates may favor cash buyers in the used market.
| Price Trend Predictions | New RVs | Used RVs |
|---|---|---|
| Next 2 years | Moderate decreases | Gradual stabilization |
| Entry-level availability | Increasing options | Limited inventory |
| Financing impact | High sensitivity | Moderate sensitivity |
Buyers should expect more negotiating power in new RV purchases while used RV prices maintain relative strength through the limited supply of quality units.
Expert Advice and Takeaways for RV Buyers and Sellers
Industry professionals emphasize looking beyond initial purchase prices and understanding the total cost of ownership. Market experts recommend timing purchases strategically and avoiding common pitfalls that can cost thousands of dollars.
Evaluating Value Beyond the Sticker Price
Smart RV buyers calculate the complete ownership picture rather than focusing solely on the advertised price. Hidden costs can quickly transform an apparent bargain into an expensive mistake.
Total Cost Components:
- Insurance premiums (vary by RV type and value)
- Storage fees ($50-$200+ monthly)
- Maintenance and repairs
- Registration and licensing
- Depreciation rates
Expert RV buyers examine maintenance records, upgrade quality, and remaining warranty coverage when evaluating used units. They also research the specific model’s reputation for reliability and common issues.
New RV buyers should factor in rapid initial depreciation. Most RVs lose 20-30% of their value within the first year. However, they offer full warranties and the latest safety features.
Inspection Checklist for Used RVs:
- Roof condition and seals
- Slide-out mechanisms
- Appliance functionality
- Tire condition and age
- Water damage indicators
Tips from Dealers and Market Analysts
Industry professionals recommend specific strategies for navigating the current market conditions. Dealers report that timing purchases during late fall and winter often yields better deals as inventory needs to be cleared.
Market analysts suggest focusing on “discontinued” models in the current year. These units offer fewer luxury features but provide lower prices and reduced weight for easier towing.
Dealer-Recommended Strategies:
- Shop multiple dealerships for comparison
- Negotiate trade-in values separately from new purchases
- Ask about manufacturer incentives and rebates
- Consider certified pre-owned programs
- Review financing options beyond dealer offerings
RV Trader and similar platforms help buyers research fair market values before negotiations. Dealers appreciate informed customers who understand realistic pricing expectations.
Best Purchase Timing:
- October through February for inventory clearance
- End of model years for discounts
- After major RV shows when dealers offer promotions
Mistakes to Avoid in the Current Landscape
Common buyer errors can cost thousands or result in unsuitable RV purchases. Market volatility makes these mistakes particularly expensive.
Critical Mistakes:
- Buying without proper size calculations for storage and towing
- Ignoring weight ratings and towing capacity
- Skipping thorough inspections on used units
- Financing without shopping rates from multiple lenders
- Purchasing during peak season without negotiating
Many buyers underestimate ongoing maintenance costs. Reports from industry analysts show that RV maintenance averages $1,200-$2,500 annually, depending on usage and RV type.
Seller Mistakes:
- Listing during the slow winter months without competitive pricing
- Neglecting minor repairs that reduce perceived value
- Overpricing based on emotional attachment rather than market data
- Failing to highlight unique features or recent upgrades
First-time buyers often purchase RVs that are too large or complex for their actual needs. Starting with a smaller, simpler unit allows for learning without major financial commitment.
Interest rate fluctuations significantly impact affordability. Buyers should secure financing pre-approval to understand their actual budget rather than relying on sticker prices alone.
Frequently Asked Questions
Market dynamics, depreciation patterns, and economic factors create complex pricing scenarios for RV buyers. Understanding these elements helps buyers make informed decisions about timing purchases and choosing between new and used options.
What factors are influencing the current RV market trends?
New RV sales are declining while the used RV market remains stable as of August. This shift reflects changing consumer preferences and economic conditions affecting purchasing power.
Manufacturing capacity adjustments impact inventory levels across dealerships. Supply chain improvements have stabilized production schedules compared to previous years.
Interest rates directly affect financing costs for both new and used RV purchases. Higher rates push some buyers toward lower-priced used models or delay purchases entirely.
Consumer confidence in recreational spending influences market demand. Economic uncertainty causes buyers to research options more thoroughly before making decisions.

How do RV depreciation rates compare between new and used models?
New RVs typically lose 20-25% of their value within the first year of ownership. This initial depreciation represents the steepest value decline in an RV’s lifecycle.
Used RVs experience more gradual depreciation after the initial ownership period. Models between 3-7 years old often retain value better than newer units.
Popular brands and floor plans maintain higher resale values across all age categories. Limited production models or discontinued features can sometimes appreciate in specific market segments.
Maintenance records and condition significantly impact depreciation rates for used units. Well-maintained RVs can outperform market averages for value retention.
What indicators should buyers monitor to predict future RV pricing fluctuations?
Manufacturing shipment data provides early signals about inventory levels reaching dealerships. Lower shipments typically lead to reduced dealer incentives and higher prices.
Seasonal patterns affect both new and used RV pricing throughout the year. Spring and summer months generally see higher demand and prices.
Used RV prices are gradually declining following seasonal trends and competitive pricing pressures from new models. This creates opportunities for buyers to time their purchases strategically.
Economic indicators like employment rates and disposable income affect recreational vehicle demand. Strong economic conditions typically support higher RV prices.
Can You Rent an RV for a Year?
What resources are available for tracking historical RV price changes?
NADA RV values provide standardized pricing data for most makes and models. These guides update regularly to reflect current market conditions.
Online marketplaces like RVTrader and Camping World show active listing prices. Comparing similar units over time reveals pricing trends.
Industry publications track wholesale auction results and dealer pricing. This data helps identify broader market movements before they reach retail levels.
Regional variations in pricing require local market research. Dealers often share insights about area-specific trends and seasonal patterns.
How have recent economic events impacted the demand for new versus used RVs?
Inflation concerns have shifted buyer preferences toward used RV options for cost savings compared to new models. This trend affects inventory turnover rates at dealerships.
Supply chain disruptions created lasting effects on production schedules. Some buyers still prefer used units to avoid potential delivery delays.
Remote work policies have increased interest in RV lifestyles during recent years. This demographic shift continues influencing market demand patterns.
Credit market conditions affect financing availability for different buyer segments. Stricter lending standards impact new RV sales more than used purchases.
What are the expected long-term outcomes for the RV market?
The RV industry shows signs of rebounding with manufacturers adapting to changing consumer demands. Innovation in electric and hybrid models may create new market segments.
Used RV markets are expected to remain competitive through this year and beyond. Inventory levels should stabilize as new production catches up with demand.
Demographic shifts toward younger buyers may influence feature preferences and pricing strategies. Technology integration becomes increasingly important for market appeal.
Regional growth in RV-friendly infrastructure supports long-term market expansion. Campground development and remote work trends provide foundational market support.
Home page
Back to the top of the page


